NIFTY 50
As on 02 May, 2025 12:44pm.
Loading...
0.00 (0.00%)
*As mandated by Exchange & other statutory authorities, the data feeds are delayed by 15 mins.
Range
Daily
52 Weeks
Daily Low
Daily High
0.00
0.00
Open
0.00
Prev.Close
0.00
Volume
0
Gift Nifty is trading at 23,835.00, up by 30.00 points, indicating a postive to flat opening for Nifty.
Rupee Desk - USD/INR: Currently trading at 85.38
Short term - Technical Outlook
The Indian stock market is set to open on a positive to flat note. GIFT Nifty is trading at 23,835, up by 30 points, indicating a gap-up opening. The US market is trading in the red, while Asian markets are trading on a mixed note.
FIIs showed a strong buying trend in the last three days. Consistency in FII buying could provide confidence in the Indian market. Also, the rupee is trading at 85.38 against the dollar. The decreasing value of the Indian rupee is considered beneficial for economy.
HDFC Bank posted strong Q4 results with a 6.7% YoY rise in net profit and 10% growth in Net Interest Income (NII), driven by steady loan book expansion and better asset quality. The results are seen as positive and could uplift overall banking sentiment.
Globally, sentiment remains cautious as US markets closed lower due to persistent concerns over inflation and the Federal Reserve’s hawkish stance. Rising treasury yields are keeping equity markets on edge. Meanwhile, escalating trade tensions between China and the US have sparked fears of supply chain disruptions and rising costs, leading to increased global volatility and a shift towards safe-haven assets. Emerging markets, including India, may feel the ripple effects of this uncertainty.
Technically, Nifty has been in a bullish trend over the past few sessions. The last session closed at 23,851, up by 414 points. Another intraday momentum can be expected above 23,880, while a downside move is expected below 23,790. Comeback of FII buying is giving strong support to the market.
FIIs were net buyers for the third time this month, purchasing 4,667 crore, while DIIs sold 2,006 crore. On a monthly basis, FIIs have sold 19,971 crore, and DIIs have bought 21,117 crore. Volatility is expected to persist amid global uncertainties.
Short term Research Report Call
Buy Above: 23,880 | Targets: 23,940, 24,000, 24,090 | Stop-loss: 23,800
Sell Below: 23,790 | Targets: 23,740, 23,680, 23,600 | Stop-loss: 23,860
Short term Chart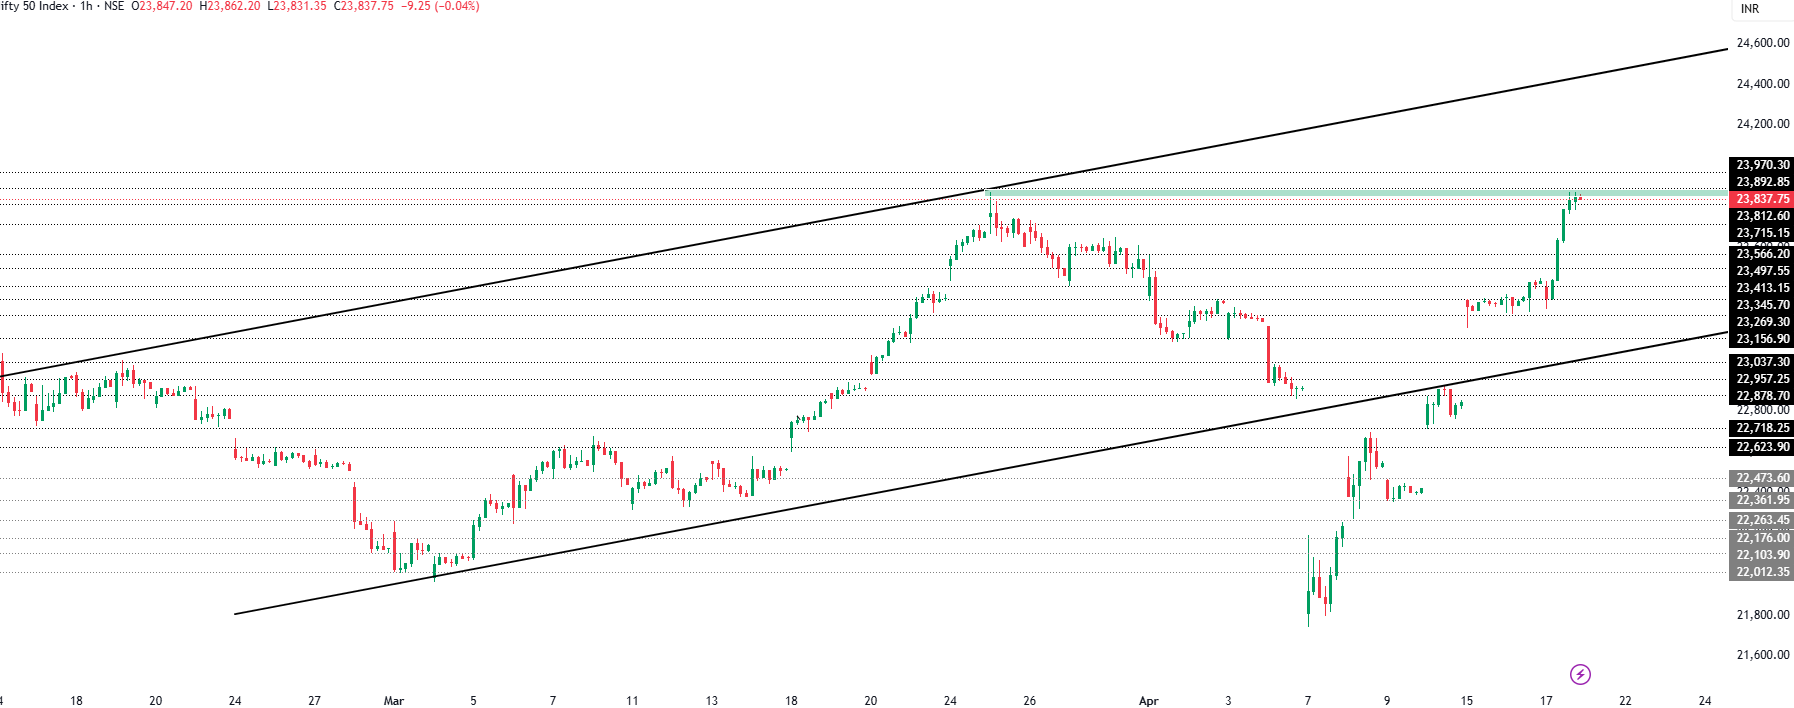
Long term - Technical Outlook
Nifty is currently trading within a broken descending channel. If it sustains above the 23,850 level, momentum is expected to build toward the 24,200–24,800 range, while a breakdown below 22,300 may trigger additional downside pressure.
Investors and short-term traders can consider a buy-on-dips strategy for the long term, as the market is currently trading at attractive valuations. Quality investments at these levels are likely to yield strong long-term returns.
Long term Research Report Call
Buy Above: 23,850 | Targets: 24,000, 24,210, 24,500 | Stop-loss: 23,700
Sell Below: 22,300 | Targets: 21,900, 21,550, 21,270 | Stop-loss: 22,500
Long term Chart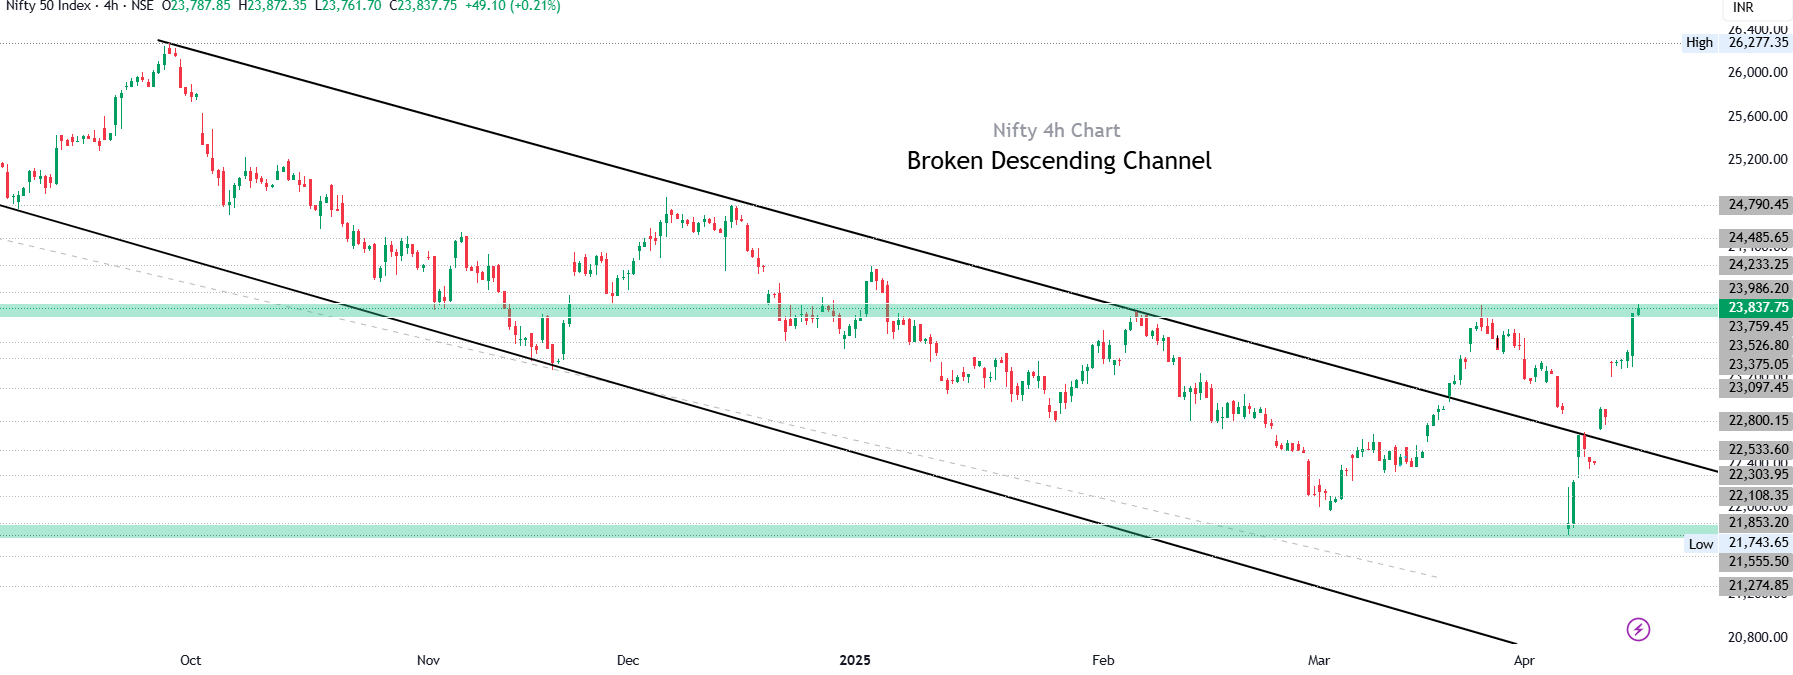
Market View
April 30th 2025
Market View
Resistance 24,300

Support 24,100
FII & DII Activities
Particular
FIIs
DIIs
Net Purchase/ Sales (Cr)
28 Apr 2025
+2,385.61
+1,369.19
MTD-May (Cr)
April
+2,684.45
+26,436.3
Indian markets opened with marginal gains today amid strong domestic and foreign investor inflows. The Sensex opened 82.42 points higher at 80,370.80, while the Nifty50 rose 6.10 points to start at 24,342.05. However, indices quickly turned flat due to mixed global cues and geopolitical tensions involving Pakistan.
As of early trade, the Sensex fell by 163.47 points to 80,124.91, and the Nifty slipped 55 points to 24,281.30. Weakness in heavyweight stocks like Bajaj Finance and Bajaj Finserv, following their Q4 results, dragged the market lower.
Market breadth was negative with 828 stocks advancing, 1224 declining, and 137 unchanged. Key gainers in the Nifty50 included Dr Reddy's Labs, L&T, Cipla, Tata Consumer, and TCS, while top losers were Bajaj Finserv, Bajaj Finance, Trent, Tata Motors, and SBI.
Despite the cautious mood, positive FPI and DII flows continue to offer crucial support, with April marking the first month of net foreign inflows in 2025.
Global Market
May 2nd 2025
NASDAQ
USA
17,710.74
264.4 1.52
2nd May
Dow Jones
USA
41,112.39
359.43 0.88
2nd May
FTSE
UK
8,496.8
1.95 0.02
1st May
DAX
GERMAN
7,593.87
0 0
30th May
GIFT Nifty
Singapore
24,432
37.5 0.15
2nd May
NIKKEI 225
Japan
36,772.98
320.68 0.88
2nd May
Shanghai
China
3,279.03
0 0
2nd May
S&P 500
USA
5,604.14
35.08 0.63
2nd May
Market at Closing
March 20th 2025
Top Gainers
| BHARTIARTL | 1,704 66.85 4.08 |
| TITAN | 3,183.05 106.75 3.47 |
| EICHERMOT | 5,234 133.1 2.61 |
| BAJAJ-AUTO | 7,920 198.15 2.57 |
Top Losers
| INDUSINDBK | 685 -7.7 -1.11 |
| BAJFINANCE | 8,680 -51.6 -0.59 |
| TRENT | 5,215 -15.85 -0.3 |
| SHRIRAMFIN | 666.3 -1.65 -0.25 |
Technicals
Pivot Advanced Levels
Check live levels for all scripts
Buy Above
24341.28
R1
24384.71
R2
24430.11
R3
24511.05
Stop Loss
24289.96
Pivot
24309.70
(All values are in INR)
Sell Below
24278.12
S1
24234.69
S2
24189.29
S3
24108.35
Stop Loss
24329.44
Pivot Basic Levels
| R4 | R3 | R2 | R1 | Pivot | S1 | S2 | S3 | S4 | |
| Classic | 24729.00 | 24618.05 | 24507.10 | 24420.65 | 24309.70 | 24223.25 | 24112.30 | 24025.85 | 23939.40 |
| Woodie | 24908.03 | 24630.30 | 24513.23 | 24432.90 | 24315.83 | 24235.50 | 24118.42 | 24038.10 | 23723.62 |
| Camarilla | 24442.77 | 24388.49 | 24370.39 | 24352.30 | 24309.70 | 24316.10 | 24298.01 | 24279.92 | 24225.63 |
Moving Averages
Bullish
Bearish
EMA
SMA
5 Day
20581.10
10 Day
19750.42
20 Day
19103.27
50 Day
18504.85
100 Day
18175.39
200 Day
17866.49
Momentum Oscillators
Stoch RSI
39.88
ROC
6.37
Ultimate
55.80
Williams
-13.68
CCI
86.67
Stochastic
92.06
RSI
63.92
Bullish
1
Bearish
2
Neutral
4
Trend Oscillators & Volatility
ATR
130.35
Low Volatility
MACD
348.36
Bullish
Bullish
1
Bearish
0
Neutral
0
Nifty Stock List
Check all stocks
| Stock Name | CMP | Change (%) | Market Cap (Cr.) | Sector | Piotroski Score |
| RELIANCE | 1418 | 0.9253 | 1905831.76 | Oil & Gas | 7 / 9 |
| HDFCBANK | 1925.9 | 0.0468 | 1472744.5 | Banks | 3 / 9 |
| HDFCBANK | 604.5 | 1.0616 | 1472744.5 | Banks | 3 / 9 |
| TCS | 3429.3 | -0.7065 | 1240877.39 | Software & IT Services | 7 / 9 |
| BHARTIARTL | 1837.2 | -1.4642 | 1135812.07 | Telecom | 8 / 9 |
Disclaimer: Investment in securities/commodities market subject to market risk, read all the related documents carefully before investing/trading.
Analyst Certification: I/We, Ayushi Jain Research Analyst, authors, and the name subscribed to this report, hereby certify that all the views expressed in this research report accurately reflect our views about the subject issuer(s) or securities. We also certify that no part of our compensation was, is, or will be directly or indirectly related to the specific recommendation(s) or view(s) in this report. NISM Research Analyst registration number – NISM-201900015194.
Frequenlty asked questions
Can I trade NIFTY50?
How are stocks selected to be a part of Nifty 50?
How does the closing price of NIFTY50 determined?
What are Nifty Futures and Options?
