BANK NIFTY
As on 02 May, 2025 12:34pm.
Loading...
0.00 (0.00%)
*As mandated by Exchange & other statutory authorities, the data feeds are delayed by 15 mins.
Range
Daily
52 Weeks
Daily Low
Daily High
0.00
0.00
Open
0.00
Prev.Close
0.00
Volume
0
Short term - Technical Outlook
The Bank Nifty index closed at 54,956, down by 75 points in the latest session. It faced resistance at higher levels and formed weak candles on the daily chart, signaling hesitation and possible profit booking near key resistance zones. However, another intraday momentum may emerge above 55,555 or below 55,150, depending on market direction.
The overall sentiment remains supported by positive global cues, strong earnings in US markets, and tariff easing talks among major global economies, which have boosted investor confidence worldwide. Additionally, sustained buying from institutional players continues to offer strength to broader markets.
FIIs bought shares worth 50 crore, while DIIs invested 1,792 crore in the last session, showing broad-based support from both foreign and domestic institutions. These flows may continue to cushion downside risks and keep intraday sentiment steady.
Short term Research Report Call
Buy Above: 55,555 | Targets: 55,920, 56,300, 56,500 | Stop-loss: 55,400
Sell Below: 55,150 | Targets: 54,920, 54,500, 54,100 | Stop-loss: 55,300
Short term Chart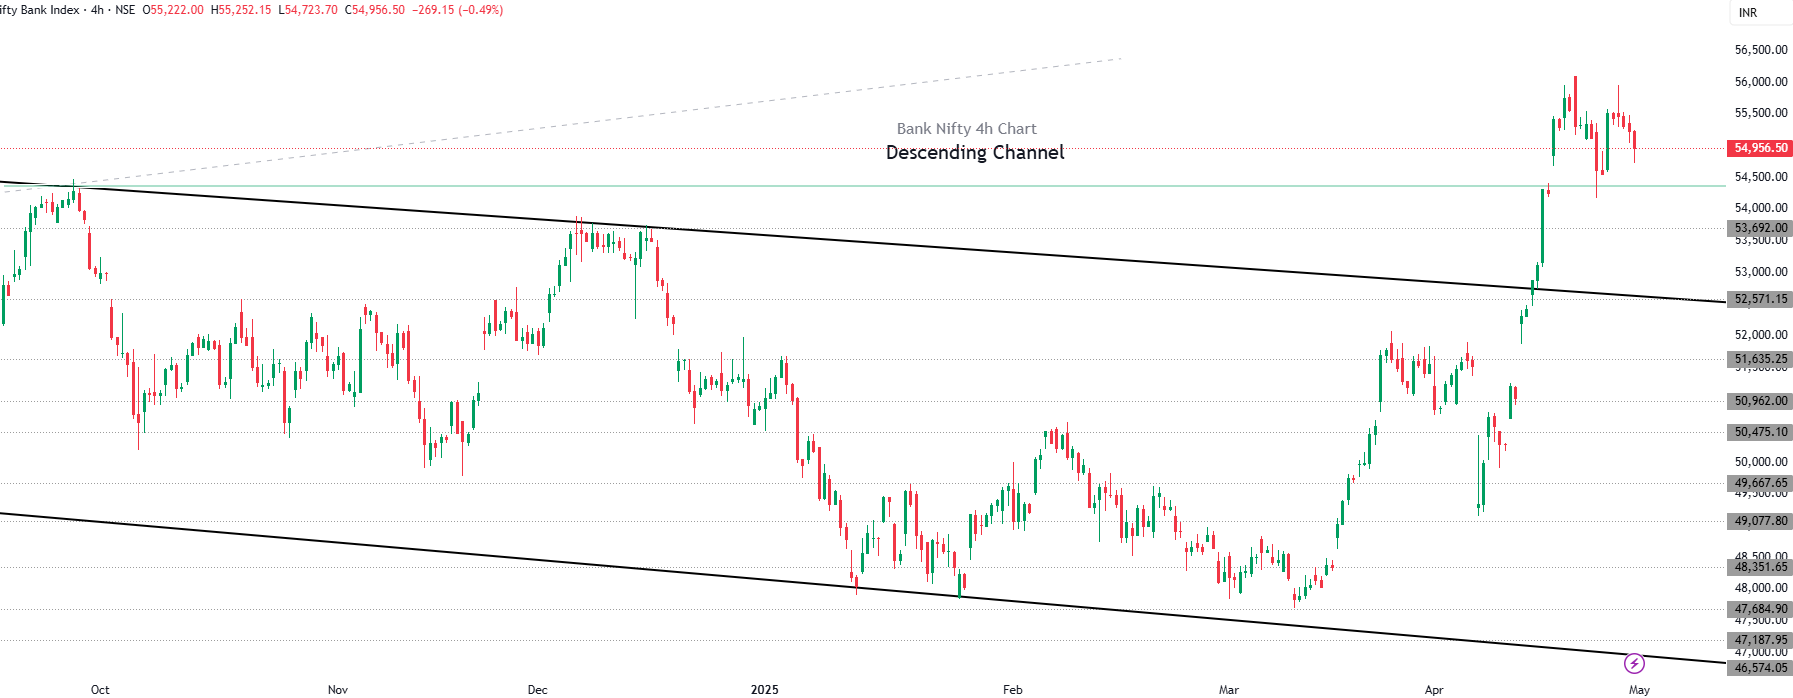
Long term - Technical Outlook
Bank Nifty took resistance from higher levels, forming weak candles on the daily chart. In the last session, it closed at 54956, down by 41 points. Technically, holding above 54,500 could keep the sentiment positive for the Indian market.
FIIs bought shares worth 50 crore, while DIIs invested 1,792 crore in the last session, showing broad-based support from both foreign and domestic institutions. These flows may continue to cushion downside risks and keep intraday sentiment steady.
Long term Research Report Call
Buy Above: 55,800 | Targets: 56,300–56,800 | Stop-loss: 55,500
Sell Below: 54,300 | Targets: 53,700, 52,600 | Stop-loss: 54,700
Long term Chart
Market View
April 30th 2025
Market View
Resistance 55,500

Support 55,000
FII & DII Activities
Particular
FIIs
DIIs
Net Purchase/ Sales (Cr)
28 Apr 2025
+2,385.61
+1,369.19
MTD-May (Cr)
April
+2,684.45
+26,436.3
Indian markets opened with marginal gains today amid strong domestic and foreign investor inflows. The Sensex opened 82.42 points higher at 80,370.80, while the Nifty50 rose 6.10 points to start at 24,342.05. However, indices quickly turned flat due to mixed global cues and geopolitical tensions involving Pakistan.
As of early trade, the Sensex fell by 163.47 points to 80,124.91, and the Nifty slipped 55 points to 24,281.30. Weakness in heavyweight stocks like Bajaj Finance and Bajaj Finserv, following their Q4 results, dragged the market lower.
Market breadth was negative with 828 stocks advancing, 1224 declining, and 137 unchanged. Key gainers in the Nifty50 included Dr Reddy's Labs, L&T, Cipla, Tata Consumer, and TCS, while top losers were Bajaj Finserv, Bajaj Finance, Trent, Tata Motors, and SBI.
Despite the cautious mood, positive FPI and DII flows continue to offer crucial support, with April marking the first month of net foreign inflows in 2025.
Global Market
May 2nd 2025
NASDAQ
USA
17,710.74
264.4 1.52
2nd May
Dow Jones
USA
41,112.39
359.43 0.88
2nd May
FTSE
UK
8,496.8
1.95 0.02
1st May
DAX
GERMAN
7,593.87
0 0
30th May
GIFT Nifty
Singapore
24,432
37.5 0.15
2nd May
NIKKEI 225
Japan
36,772.98
320.68 0.88
2nd May
Shanghai
China
3,279.03
0 0
2nd May
S&P 500
USA
5,604.14
35.08 0.63
2nd May
Market at Closing
March 20th 2025
Top Gainers
| BHARTIARTL | 1,704 66.85 4.08 |
| TITAN | 3,183.05 106.75 3.47 |
| EICHERMOT | 5,234 133.1 2.61 |
| BAJAJ-AUTO | 7,920 198.15 2.57 |
Top Losers
| INDUSINDBK | 685 -7.7 -1.11 |
| BAJFINANCE | 8,680 -51.6 -0.59 |
| TRENT | 5,215 -15.85 -0.3 |
| SHRIRAMFIN | 666.3 -1.65 -0.25 |
Technicals
Pivot Advanced Levels
Check live levels for all scripts
Buy Above
55217.09
R1
55383.10
R2
55556.64
R3
55866.01
Stop Loss
55020.91
Pivot
55096.37
(All values are in INR)
Sell Below
54975.64
S1
54809.64
S2
54636.09
S3
54326.73
Stop Loss
55171.82
Pivot Basic Levels
| R4 | R3 | R2 | R1 | Pivot | S1 | S2 | S3 | S4 | |
| Classic | 56596.25 | 56223.58 | 55850.92 | 55469.03 | 55096.37 | 54714.48 | 54341.82 | 53959.93 | 53578.05 |
| Woodie | 57357.71 | 56218.98 | 55848.61 | 55464.43 | 55094.06 | 54709.88 | 54339.51 | 53955.32 | 52830.41 |
| Camarilla | 55502.15 | 55294.65 | 55225.48 | 55156.32 | 55096.37 | 55017.98 | 54948.82 | 54879.65 | 54672.15 |
Moving Averages
Bullish
Bearish
EMA
SMA
5 Day
47602.38
10 Day
45893.66
20 Day
44930.82
50 Day
43696.44
100 Day
42734.31
200 Day
41451.92
Momentum Oscillators
Stoch RSI
48.74
ROC
7.99
Ultimate
48.53
Williams
-16.54
CCI
71.10
Stochastic
85.64
RSI
53.35
Bullish
1
Bearish
2
Neutral
4
Trend Oscillators & Volatility
ATR
405.16
Low Volatility
MACD
616.11
Bullish
Bullish
1
Bearish
0
Neutral
0
Nifty Stock List
Check all stocks
| Stock Name | CMP | Change (%) | Market Cap (Cr.) | Sector | Piotroski Score |
| HDFCBANK | 1926 | 0.0519 | 1472744.5 | Banks | 3 / 9 |
| HDFCBANK | 604.5 | 1.0616 | 1472744.5 | Banks | 3 / 9 |
| ICICIBANK | 1436.2 | 0.6447 | 1014550.55 | Banks | 8 / 9 |
| SBIN | 792.45 | 0.4818 | 703393.9 | Banks | 5 / 9 |
| KOTAKBANK | 2172.6 | -1.6077 | 438568.249 | Banks | 6 / 9 |
Disclaimer: Investment in securities/commodities market subject to market risk, read all the related documents carefully before investing/trading.
Analyst Certification: I/We, Ayushi Jain Research Analyst, authors, and the name subscribed to this report, hereby certify that all the views expressed in this research report accurately reflect our views about the subject issuer(s) or securities. We also certify that no part of our compensation was, is, or will be directly or indirectly related to the specific recommendation(s) or view(s) in this report. NISM Research Analyst registration number – NISM-201900015194.
Frequenlty asked questions
Can I trade NIFTY50?
How are stocks selected to be a part of Nifty 50?
How does the closing price of NIFTY50 determined?
What are Nifty Futures and Options?
