Crude Oil
Friday 2 May, 2025
Short term - Technical Outlook
In the last session, Crude experienced significant volatility. It took support from a major level at 4810–4820; below this level, another fall is expected. Technically, Crude Oil is trading in a weak territory now. A strong close above the 5150 range is needed to confirm another upward trend. In the last session, it closed at 4972, up by 20 points, indicating a possible breakdown toward lower levels. Downside is expected in the coming days. Further momentum is likely above 5000; however, a breakdown below 4954 could trigger additional downside pressure. Holding below 5100 could lead to further weakness.
Short term Research Report Call
Buy Above: 5000 | Targets: 5030, 5070, 5110 | Stop-loss: 4970
Sell Below: 4950 | Targets: 4922, 4890, 4822 | Stop-loss: 4990
Short term Chart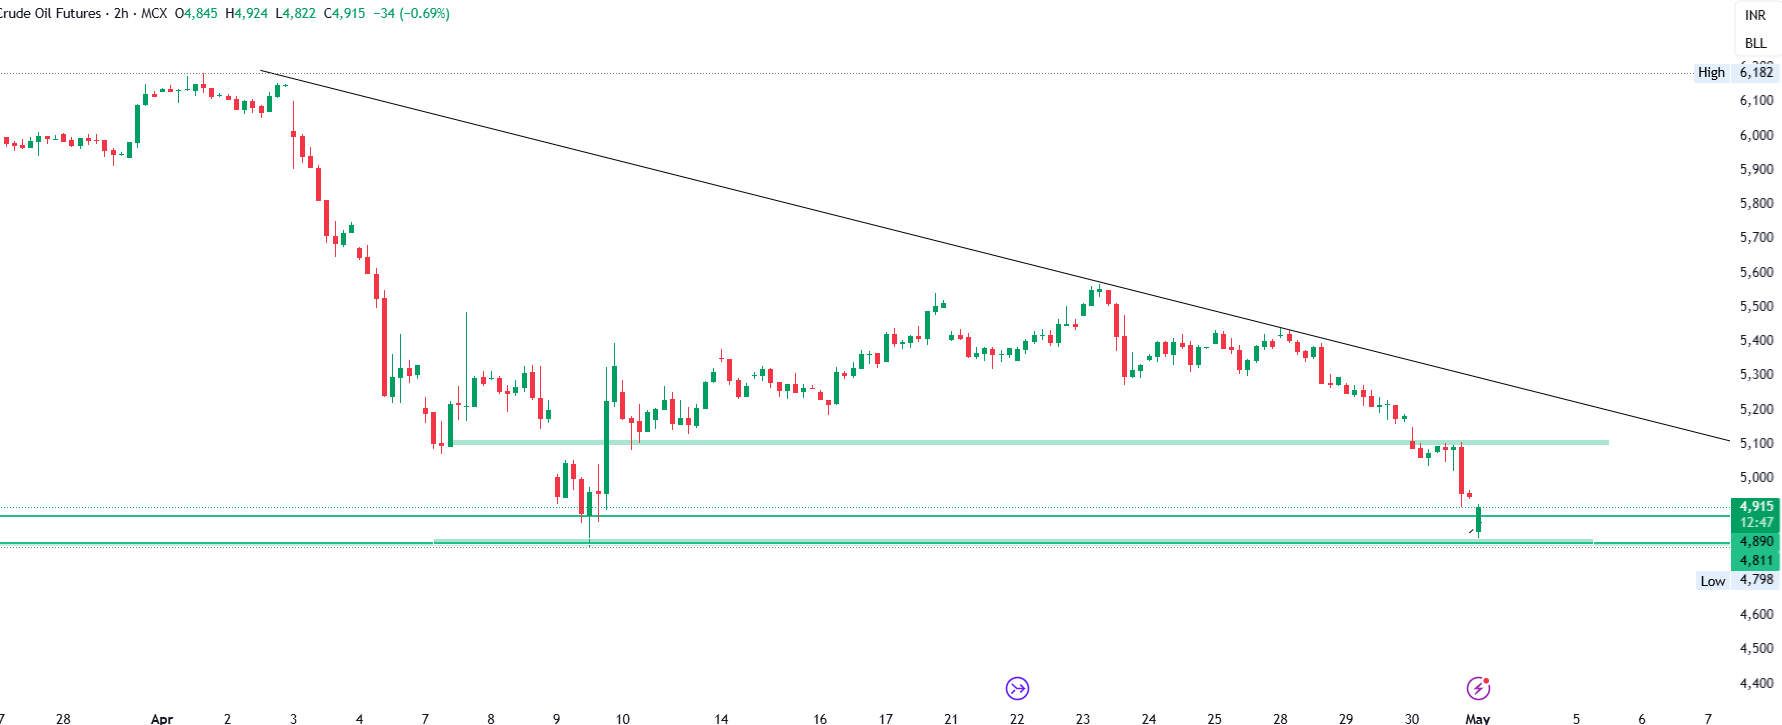
Validity
19/05/2025
Pivot
4937.00
Buy Above
4968.20
R1
5011.10
R2
5055.95
R3
5135.90
Stop Loss
4956.50
Pivot
4937.00
(All values are in INR)
Sell Below
4905.80
S1
4862.90
S2
4818.05
S3
4738.10
Stop Loss
4956.50
Gold
Friday 2 May, 2025
Short term - Technical Outlook
In the last session, Gold closed at 92,339, down by 2,369 points. It experienced strong volatility throughout the session. Trading below 93,000 could add further weakness to Gold. There is also a chance it may take support near the 91,517 level. For intraday traders, a move above 92,740 may indicate upside potential, while a dip below 92,100 could trigger further downside.
Short term Research Report Call
Buy Above: 92,740 | Targets: 93,435, 93,680, 94,570 | Stop-loss: 92,700
Sell Below: 92,100 | Targets: 91,800, 91,420, 91,000 | Stop-loss: 92,600
Short term Chart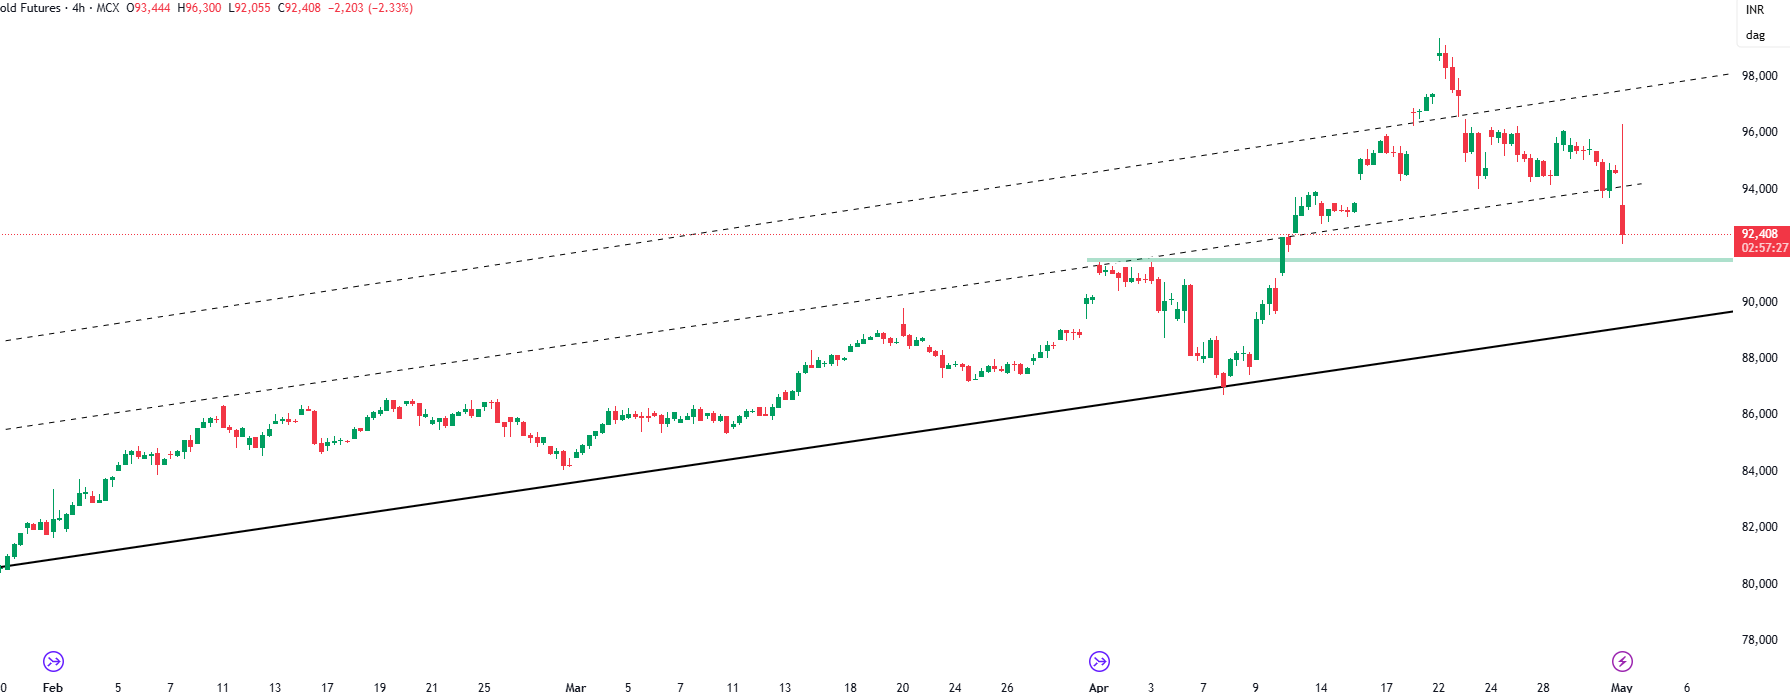
Validity
05/06/2025
Pivot
93564.67
Buy Above
94243.87
R1
95177.77
R2
96154.12
R3
97894.57
Stop Loss
93989.17
Pivot
93564.67
(All values are in INR)
Sell Below
92885.47
S1
91951.57
S2
90975.22
S3
89234.77
Stop Loss
93989.17
Natural Gas
Friday 2 May, 2025
Short term - Technical Outlook
Natural Gas experienced significant volatility in the last session. It closed at 290.6, up by 9.7 points. Technically, Natural Gas is entering a bullish trend. Another intraday move is likely above 292, while downside pressure could emerge below 282. It is currently facing resistance in the 292–293 range.
Short term Research Report Call
Buy Above: 292 | Targets: 295, 300.5, 311 | Stop-loss: 289
Sell Below: 282 | Targets: 277, 272, 265 | Stop-loss: 279
Short term Chart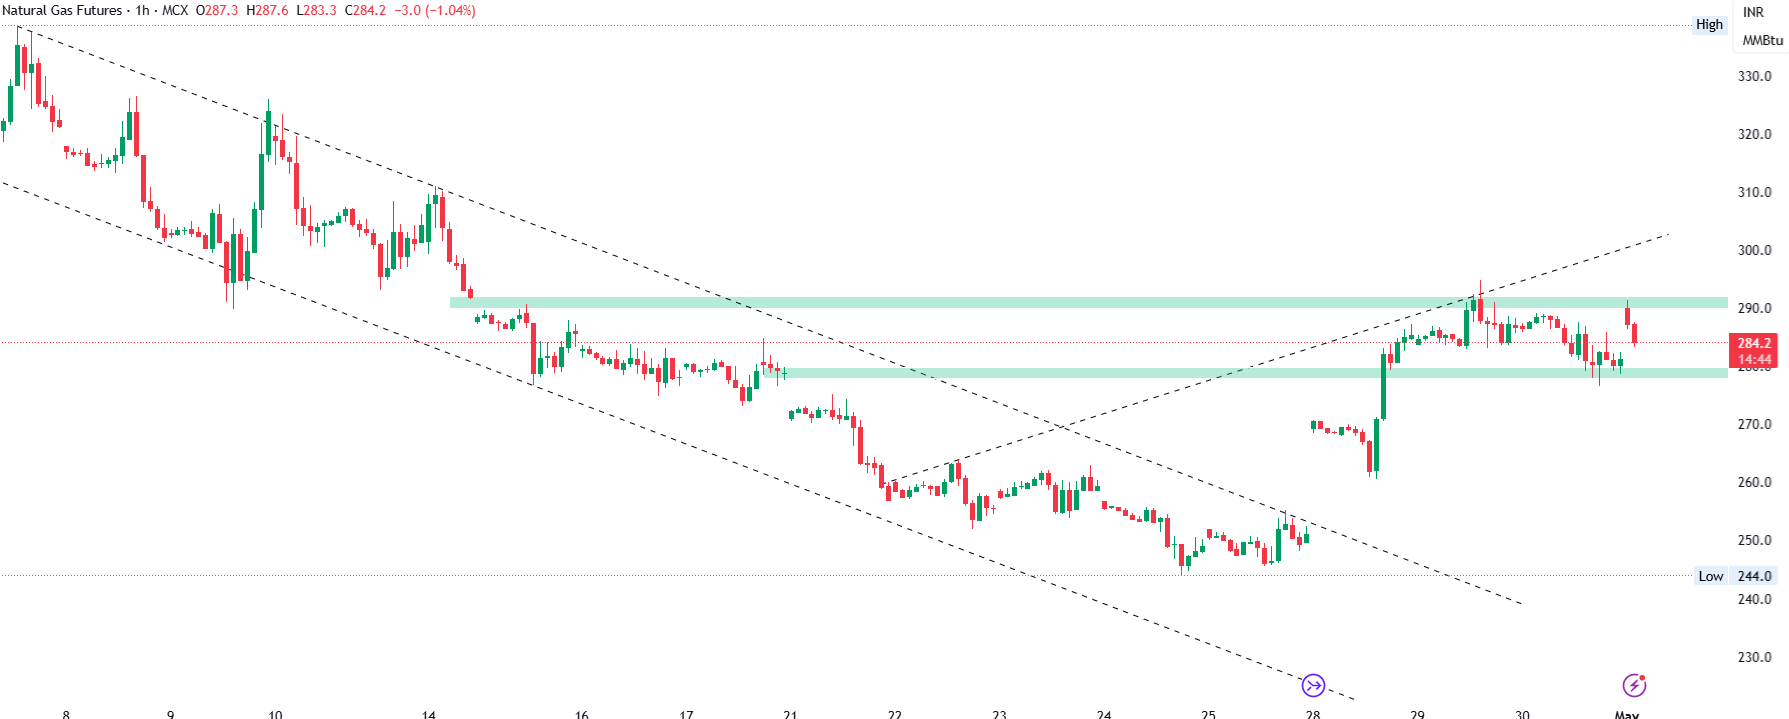
Validity
27/05/2025
Pivot
288.63
Buy Above
290.03
R1
291.94
R2
293.94
R3
297.51
Stop Loss
289.50
Pivot
288.63
(All values are in INR)
Sell Below
287.24
S1
285.33
S2
283.33
S3
279.76
Stop Loss
289.50
Note: Above information is not recommending any buy or sell position, this is for your reference only and trading or investment in commodities & derivatives is subject to market risk.
Disclaimer: Investment in securities/commodities market subject to market risk, read all the related documents carefully before investing/trading.
Analyst Certification: I/We, Ayushi Jain Research Analyst, authors, and the name subscribed to this report, hereby certify that all the views expressed in this research report accurately reflect our views about the subject issuer(s) or securities. We also certify that no part of our compensation was, is, or will be directly or indirectly related to the specific recommendation(s) or view(s) in this report. NISM Research Analyst registration number – NISM-201900015194.
